The H1N1 Flu Outbreak of 2009
The H1N1 pandemic was one of the top threats to public health in the past decade. In Champaign County, we prepared for it long before it arrived in the region. This was accomplished through the joint effort of CUPHD and the University of Illinois' College of Veterinary Medicine Geographic Information System and Spatial Analysis Lab. These two organizations worked towards a directed push for vaccinations. One of the several notable features of this drive was that collaboration, technology and infrastructure were in place long before the pandemic arrived in our community. This enabled quicker response, helped maximize available resources, resulted in a larger vaccination rate and kept the practice low cost and replicable for other communities.
Some of the public health issues addressed during the H1N1 prevention work included assessment of the community demographics, resource availability and reaching the at-risk and vulnerable population through our vaccination efforts so as to curb the impact of the pandemic.
Geographical Information Systems were employed to map the client data received from the daily H1N1 drive along with demographic information. The maps were then studied to evaluate the efficacy of the H1N1 vaccination initiatives. Gaps in planning and outreach were identified and outreach efforts were altered to make up for these inadequacies.
Main Objectives
- To develop and use a protocol for creation of maps of vaccinated individuals by place of residence integrated with census data, schools and other critical facilities using geographic information systems.
- To develop and use mapping methods to provide timely information to decision-makers at CUPHD to ensure the inclusion of vulnerable populations during the delivery of H1N1 vaccines.
- To develop and use mapping methods to provide timely information to decision-makers at CUPHD to ensure the inclusion of vulnerable populations during the delivery of H1N1 vaccines.
Timeline of the H1N1 Pandemic
The H1N1 drive began in early October 2009 and mapping of H1N1 Flu shots continued through December 2009. During this period H1N1 maps were effectively utilized to better suit the needs of the emergency. Planning and preparation for the H1N1 drive started in spring 2009 with vaccinations having been distributed by early October. Schools, daycare centers and health facilities within Champaign County were mapped using ArcGIS, well in advance to assist the H1N1 drive. The Champaign-Urbana area was able to avoid a large outbreak through the utilization of mapping technology during the planning process.August - September 2009:
Work during August-September involved identification and mapping of all schools, daycares and healthcare facilities in Champaign County.October 2009:
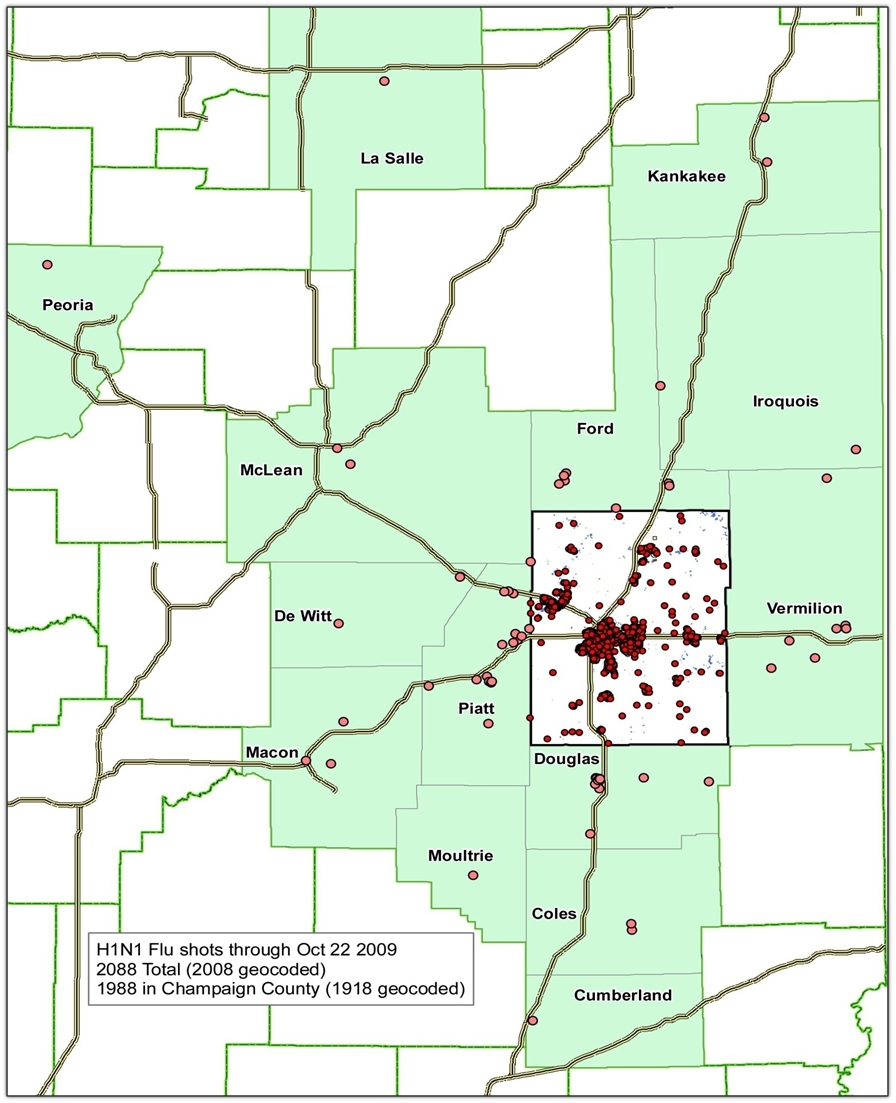
Real time mapping of H1N1 clients started as the H1N1 drive began. The total population vaccinated by the end of first month of the drive was 2088. Out of these 2008 were successfully geocoded. Also in terms of the source for these H1N1 flu shot clients, around 95 percent of these H1N1 Flu shots clients were from within Champaign County.November 2009:
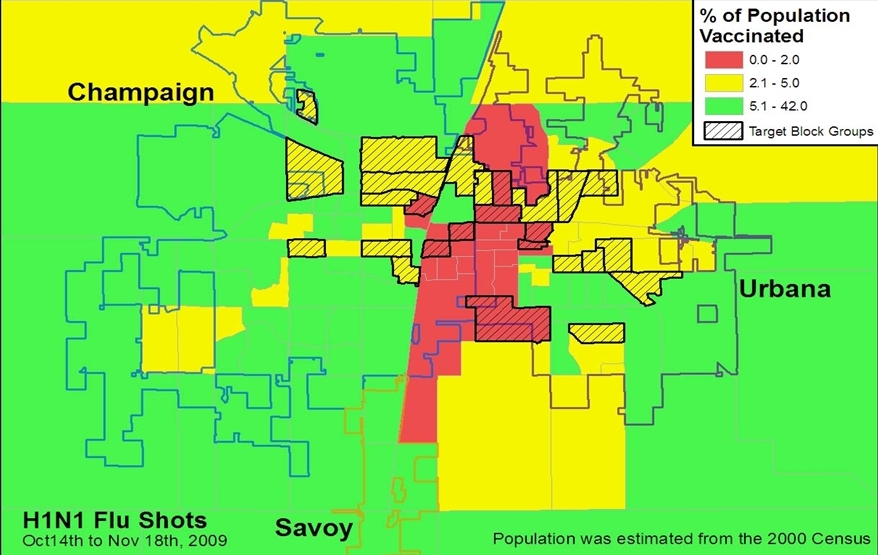
Change in distribution of population that got vaccinated, was mapped and studied. As the drive progressed this spatial distribution was regularly analyzed and updated as and when fresh set of clients were received and target areas were revised accordingly. By the end of November, the total population vaccinated for H1N1 was 11,261.December 2009:
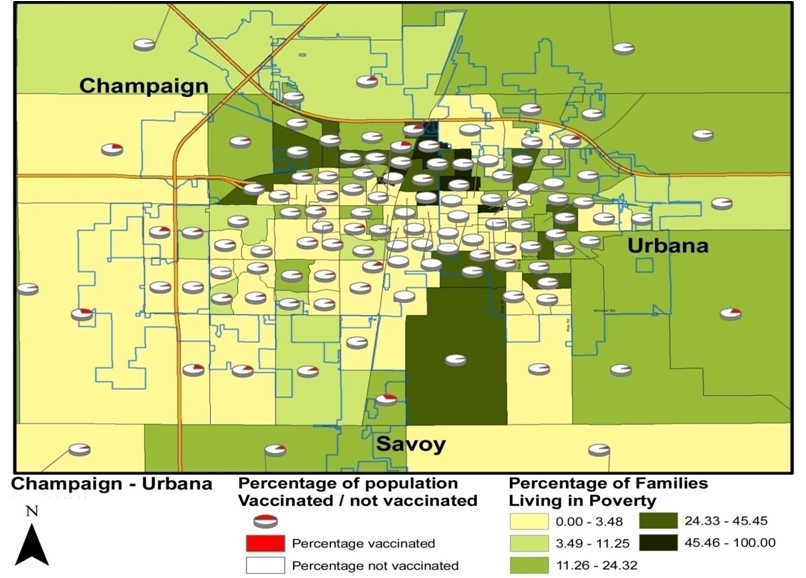
After collecting sufficient sample size the entire data was analyzed with respect to census data to identify spatial distribution pattern. Some of the aspects studied were location of low income neighborhoods, older age population etc. By the end of December, the total H1N1 flu shot clients successfully mapped were 17,464 which formed 94 percent of the given addresses. Also around 37 percent of the total H1N1 flu shot clients received were from within Champaign Urbana. Maps were prepared showing the spatial distribution of H1N1 clients with respect to various factors – poverty, population, distribution of student population and age groups.Block groups with less than 5 percent H1N1 flu shot vaccination rates and high poverty levels were identified as target areas. This helped identify areas with less than average representation at the H1N1 drive. This information was then used by CUPHD to plan their H1N1 outreach programs.
Another use of these target area maps was dissemination of information to general public. By mid December, the target area maps were distributed through News Gazette to help raise public awareness and to encourage increased participation.
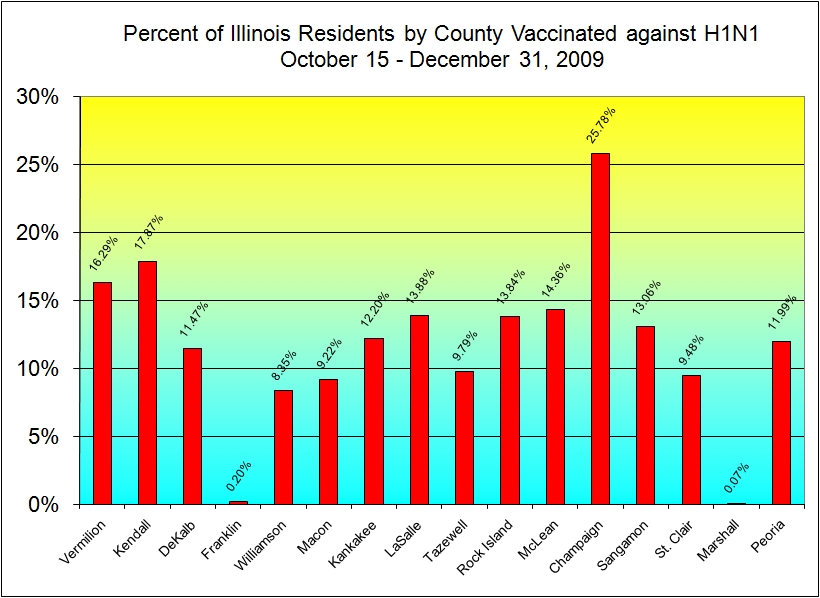
Through the these combined efforts Champaign County was able to reach and vaccinate almost 26% of the population. The above histogram compares vaccinations as a percent of total population for several counties in Illinois.
Additional Resources
Links:1. Flu Tracker


